In a previous post we covered how important excess mortality is to accurately measuring death rates. In this post, we give a recap on the definition and provide an app that gives real time excess mortality estimates for Ireland.
You can read more about the details below, but here is the app:
What is excess mortality and how is it calculated?
In epidemiology and public health, excess mortality refers to the number of deaths from all causes over and above what we would have expected under usual conditions. Here, we are interested in how deaths during the COVID-19 pandemic differ from the average number of deaths in previous years during the same period.
In particular, we don’t want to only count deaths that have been officially attributed to COVID-19, because that often misses deaths that occurred outside of hospitals, or because of the knock-on effects of COVID-19, such as increased waiting times for other treatments.
There are various ways of evaluating excess mortality, but here are the steps we followed to estimate it and visualise the results:
We collected death notices published on the RIP.ie website as the input data to our excess mortality calculations. The obvious drawback of using RIP.ie postings is that it does not include all the deaths happening in the country, but as we are only looking at the ratio of the postings in 2020 to the average of previous years, we think the data allows us to provide a reasonable estimation. Meanwhile, a benefit of RIP.ie is that it can provide us with sub-county level data that is recorded near real time.
After collecting the data, it is possible to calculate the ratio of the total postings for any specific time period in 2020 to the average of the same period over the past five years. More specifically we define excess mortality from date a to b as:
\[Excess~Mortality\mbox{%} = \frac{Deaths_{2020}(a,b) - Average~Deaths_{2015 -2019}(a,b)}{Average~Deaths_{2015-2019}(a,b)} \]
We calculated the above excess mortality rate for the whole country as well as many sub-areas. The app above displays the results of these calculations.
Excess mortality tracking app
Our excess mortality tracking app above allows you to visualise the severity of the excess mortality across the country on a map of Ireland. You can simply hover your pointer over the map to open a pop-up that includes the ratio of excess mortality (compared to the average for the last five years) for your selected region for the past 28 days.
Furthermore, you can observe the excess mortality rate changing over time. If you click on a region from the map, a time series plot for that specific region will be shown.
You have the option to visualise both the percentage change and the absolute values of the excess mortality by selecting between the “Percentage” and “Absolute” buttons.
The app is updated on a daily basis, and the national excess mortality rate is shown in the second tab for the past 28 days. Again you can observe the excess mortality rate changing overtime on the national level just by clicking on the “Show complete data” button. Finally, by selecting the “Heat map” tab you can visualise the excess mortality changing over time for all of the regions clustered by their similarities in excess mortality conditions.
Linking excess mortality to confirmed cases
As we mentioned at the beginning of this post, excess mortality in 2020 is expected to be caused mostly by the COVID-19 pandemic and its knock-on effects. Accordingly, we expect to see a high correlation between the number of COVID-19 cases and excess mortality over time. This is likely to occur at a lagged rate, as it can take several weeks for those who catch COVID-19 to die from it.
In an earlier post we estimated the ‘true’ number of cases in Ireland. We can now plot that estimate of the number of cases against our excess mortality percentage. This gives the following plot:
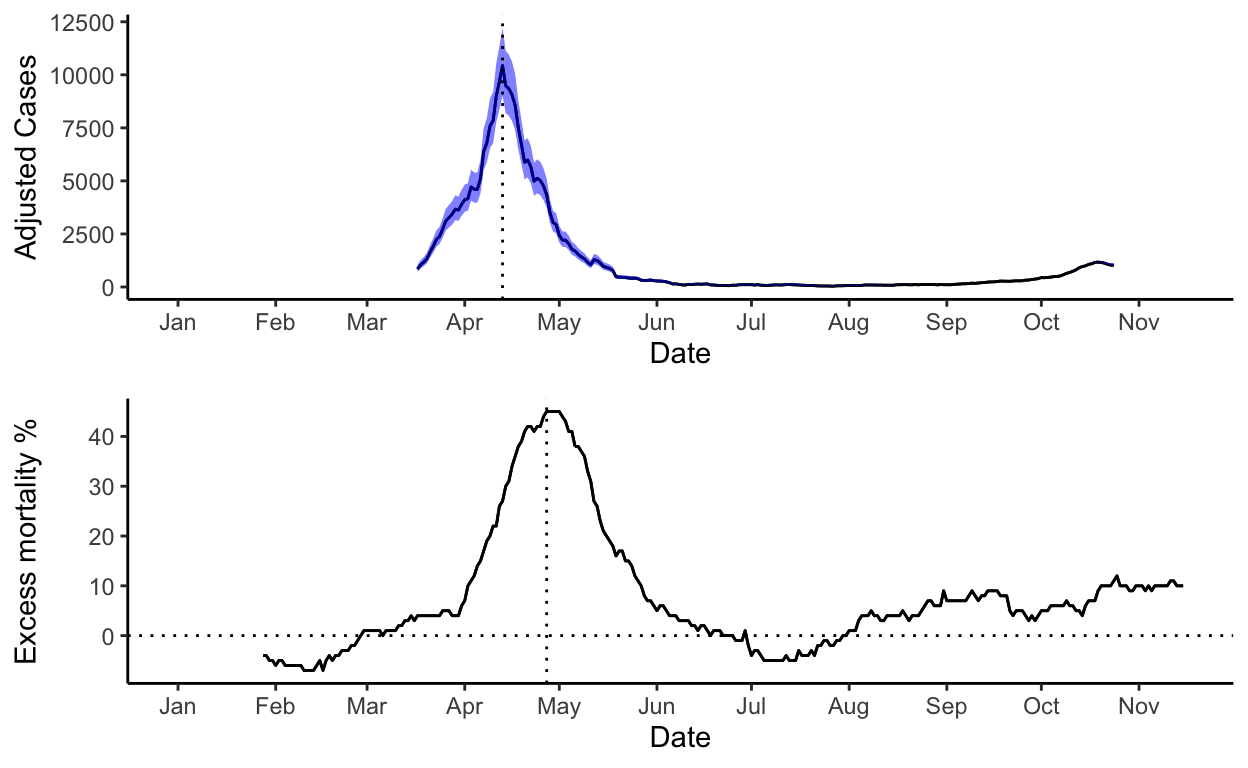
The top panel shows our estimate of the true number of cases, the bottom panel the excess mortality. Remember excess mortality is measured as a percentage above normal levels. We can clearly see that the two peaks in the adjusted number of COVID-19 cases and that the excess mortality rate happened in April, with the peak of the adjusted number of cases being 17 days ahead of the excess mortality’s peak. It seems that Ireland has been running at a slight increase of 5-10% of excess mortality from September to November, compared to previous years.
Summary
As in our other posts, it certainly seems that the second wave has been much milder than the first for mortality, though the slight increase in excess mortality between September and November is worrying.
Ireland currently has no way of tracking official excess mortality. The Eurostat website gives estimates for many European countries but not Ireland. Even HIQA, the government organisation, relies on RIP.ie to estimate excess mortality, which seems very surprising. Hopefully with this new app we can more quickly spot future trends and changes in excess mortality.
As with all our work, we have put the code in our GitHub repositories so that others can check and improve our code. If you spot any mistakes please get in contact.