How has the Irish economy been affected by the COVID-19 pandemic? We really wanted to look at that in our COVID-19 project. It is a challenge, however, to get real-time information on the performance of the Irish economy. The oft-used measures such as unemployment or GDP are only available at monthly or quarterly time resolutions.
We were hoping to identify changes in behaviour at a more instantaneous level. In this post, we look at some other economic indicators and how they might have been affected by lockdown decisions.
Looking at the Irish stock exchange
Our first idea was to look at stock exchange data, to see whether lockdown decisions taken by the Government might have led to individual shocks. Below is a plot of the daily closing ISEQ price against the dates of the main socio-economic measures as provided by the ACAPS service.
It’s quite clear that the socio-economic measures imposed by the government occurred after the fall in the index happened. If you hover your mouse at the top of the red lines you will see what the measures were. We found repeatedly across different countries that economic measures were introduced after the fall in the market.
Plotting against intervention score
An extra data set that might match the econometric data is the Oxford Non-Pharmaceutical Interventions (NPI) data set. They produce stringency indices based on the overall lockdown status, the degree of Government intervention and the containment/health degree of intervention. More details can be found here.
Like the previous plots, the stringency index increases after the ISEQ fall.
Plotting against Google Trends
Yet another alternative to the stringency index is to plot against Google trends data. This measures (via a relative score) how many people are searching for items associated with COVID-19.
This looks like a much closer relationship. But now we’re in danger of falling into the Google Flu trends trap, where internet searches about symptoms could relate to other health conditions rather than the one you are seeking to track.
Plotting Irish credit card data
To come to our rescue, the Central Bank provide information on credit card spending at a daily resolution:
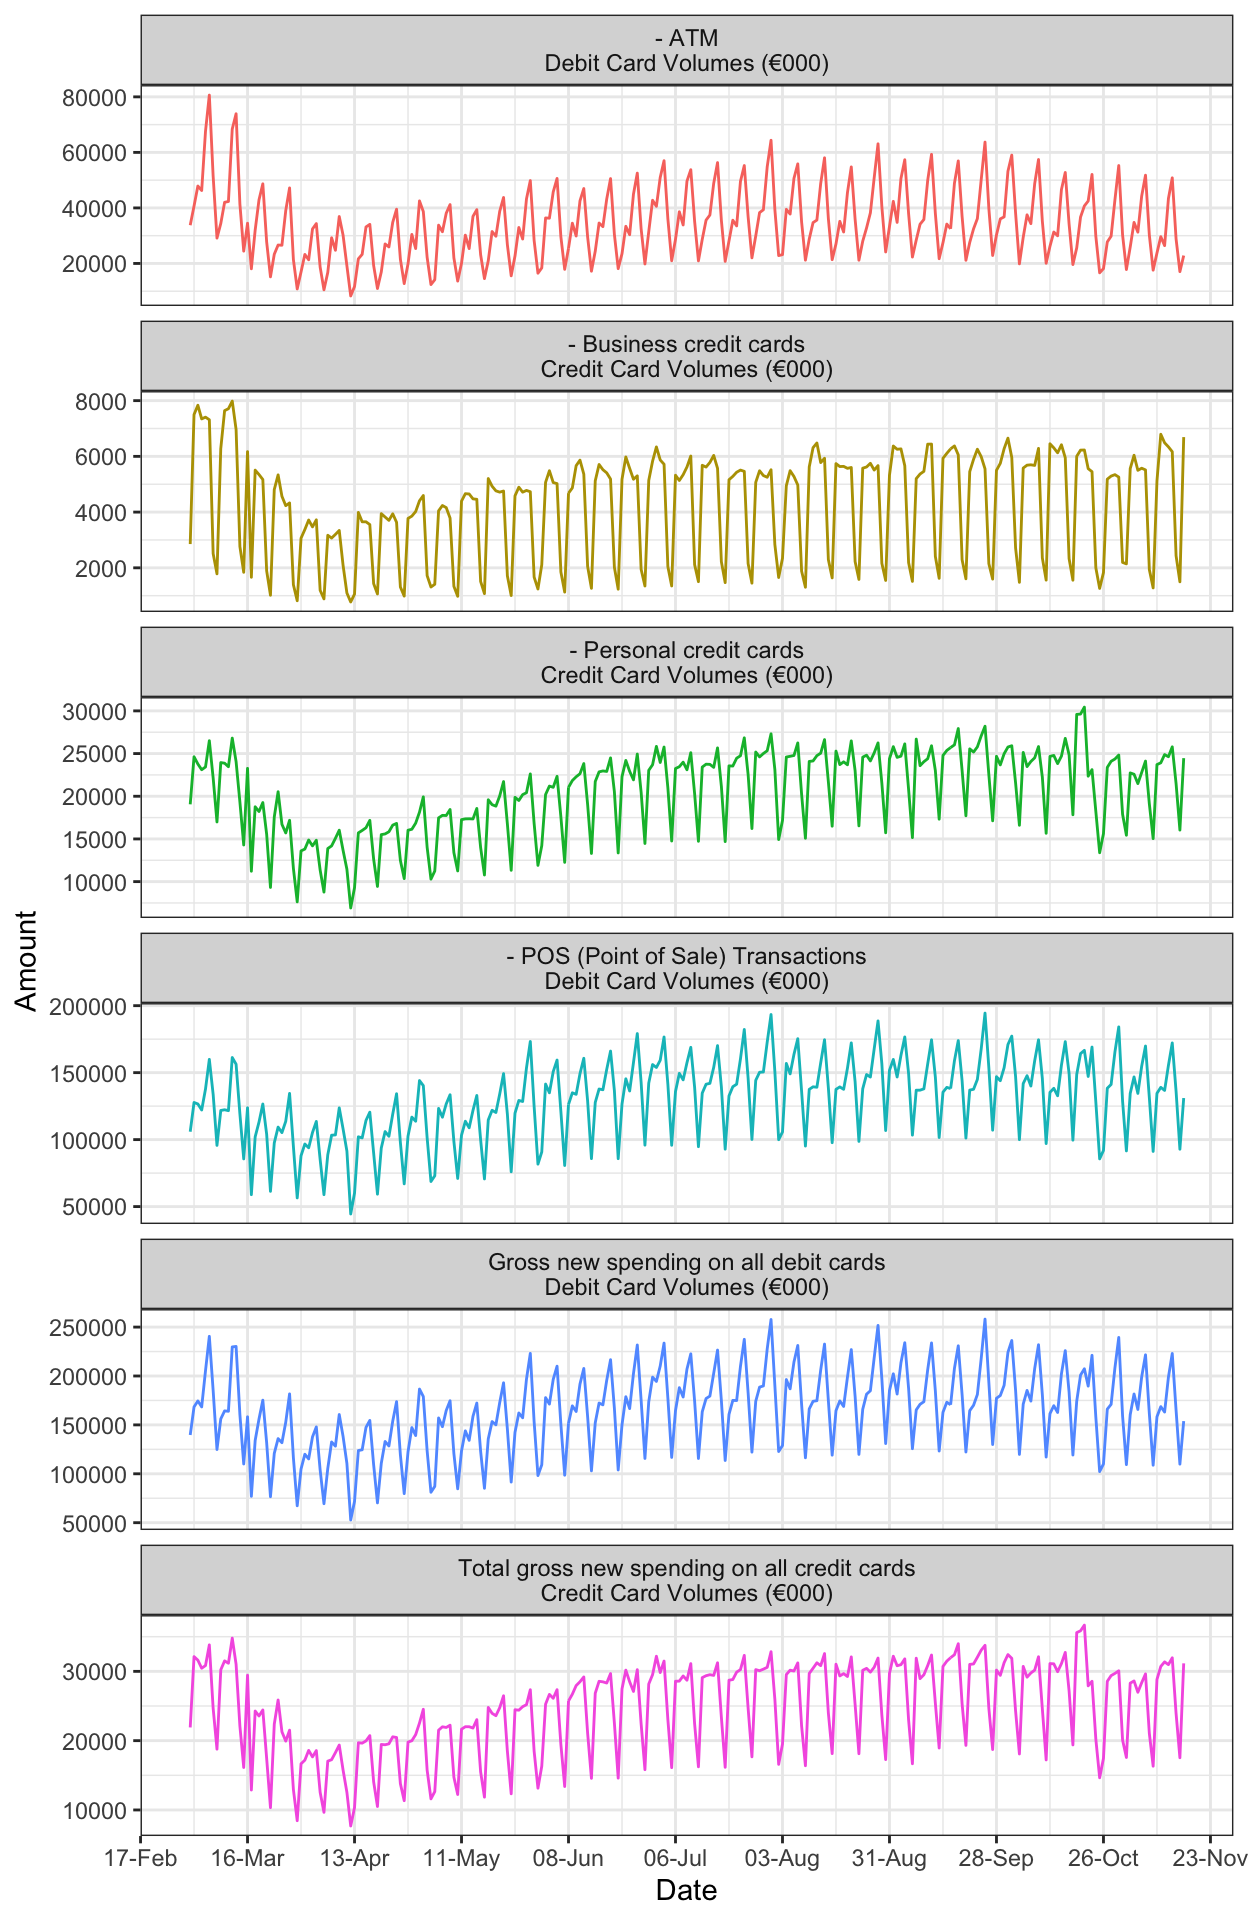
This is a big plot, but it’s a fascinating data set. Can we now work out whether these values are affected by COVID-19 public health interventions?
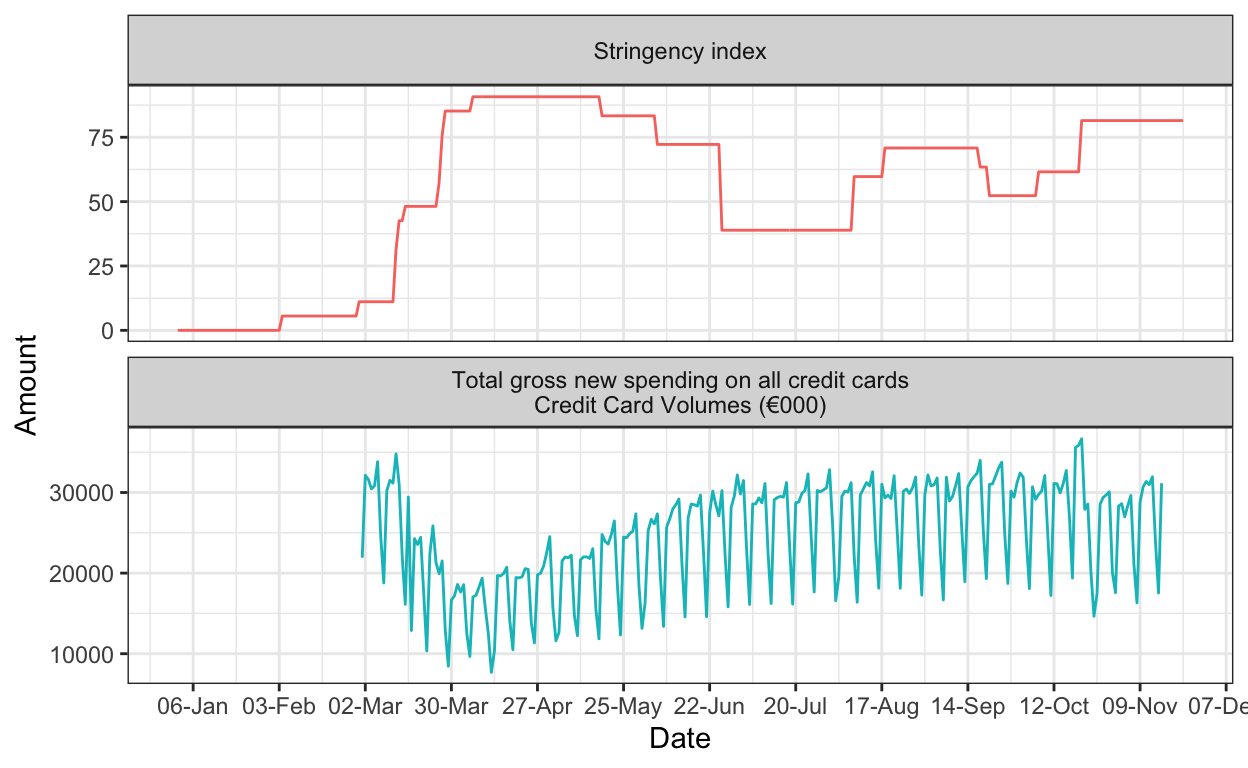
We can plot, for example, the total credit card volumes alongside the stringency index.
The forecast package has some neat functions to work out the effect of interventions. We can then plot the counterfactual: what would the credit card spend be if the lockdown hadn’t occurred?
We do this by fitting a statistical model to the data which estimates the effect of the intervention score for each day’s spending. We then use that model fit to estimate what the series would have looked like if all the lockdown measures were 0 each day.
So what was that cost to the Irish Economy? How much did consumers not spend on their credit cards? This plot shows both the original values of how much was spent, against the amount that the model estimates if the lockdown had not occurred (the ‘counterfactual’):
So to finally answer the question; ‘How much did we not spend on our credit cards due to the lockdown?’ we can simply take the difference between the two curves and them up. Here is the R code and the answer:
This is in €000s so the final answer is actually approximately €2 billion !!!
Postscript:
As with all statistical approaches, there are assumptions that are required to fit the model; here for example including the assumed weekly seasonality of what we spend, the long-term trend in the data, and of course the uncertainties in the model’s predictions. An alternative model, and requiring further analysis, would use last year’s credit card spend data too.
Finally, if you want to see the code behind this plot see our GitHub repository.