A recent timeline of events over the past few months of the ‘second wave’:
- 15th September government introduced the 5 levels with all counties on level 2 except Dublin which was level 2+
- 19th September Dublin moved to level 3 for 3 weeks until 9th October
- 25th September Donegal moved to level 3 for 3 weeks until 16th October
- (4th October NPHET recommends entire county move to level 5 for 4 weeks - rejected by government)
- 6th October entire country moves to level 3 for 3 weeks
- 15th October government bans household visits for entire country and moves Cavan, Donegal, and Monaghan to level 4
- (16th October NPHET recommends level 5 again)
- 21st October entire country moves to level 5 lockdown for 6 weeks
Context: An article in the Irish Times (October 23rd) suggests that the overall percentage of COVID-19 tests that return a positive result for the virus is dropping, and that this might be due to the level 3 restrictions. However another article (October 20th) and yet another article (October 5th) suggest that might not be the case. Which of these is supported by the data?
We know the numbers of positive cases recorded each day for each county. That’s a good starting point to start answering this question. If we also knew, county by county, the numbers of COVID-19 tests carried out per day and the percentage of tests that were positive (positivity rate) for each county, then we could easily measure the effects of levels 3 and 4.
However, we don’t have all those data for each county. So let’s work with what we have: daily numbers of positive cases for each county, and nationwide numbers of tests carried out each day and the percentage of positive tests returned over the previous 7 days. It’s a start.
If level 3 worked, we would expect to see the daily numbers of cases decrease, or at least rise less steeply, after a month or so.
There’s also the issue of the definition of what you mean by ‘worked’.
You might consider that level 3 worked if it decreased the number of cases of COVID-19 infection, or even if it just slowed the rate of increase down. However, slowing down the rate of increase might not be enough if the number of cases was already high.
Dublin’s level of disease and positivity rate
Let’s make a first plot of the daily number of cases reported in Dublin since the 15th September, when Dublin entered level 3:
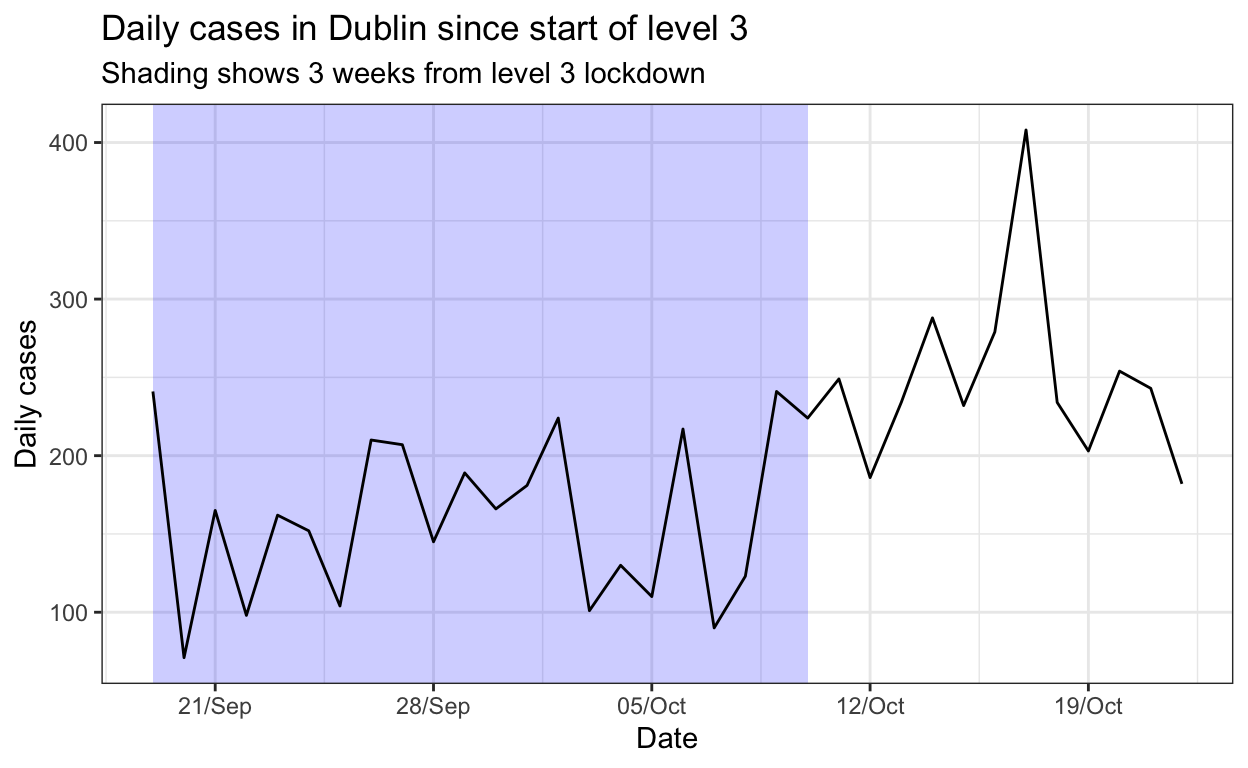
This seems to show that positive COVID-19 case numbers in Dublin were not rising that much in the first three weeks of level 3, and that the peak in cases came after three weeks of level 3 ended.
But if more COVID-19 tests were being carried out, one might expect more cases to be identified. So did the number of tests being carried out in Dublin rise four weeks after level 3 started? Unfortunately we don’t have the number of COVID-19 tests carried out in specifically in Dublin for that period, but we do have the numbers of tests for the whole country:
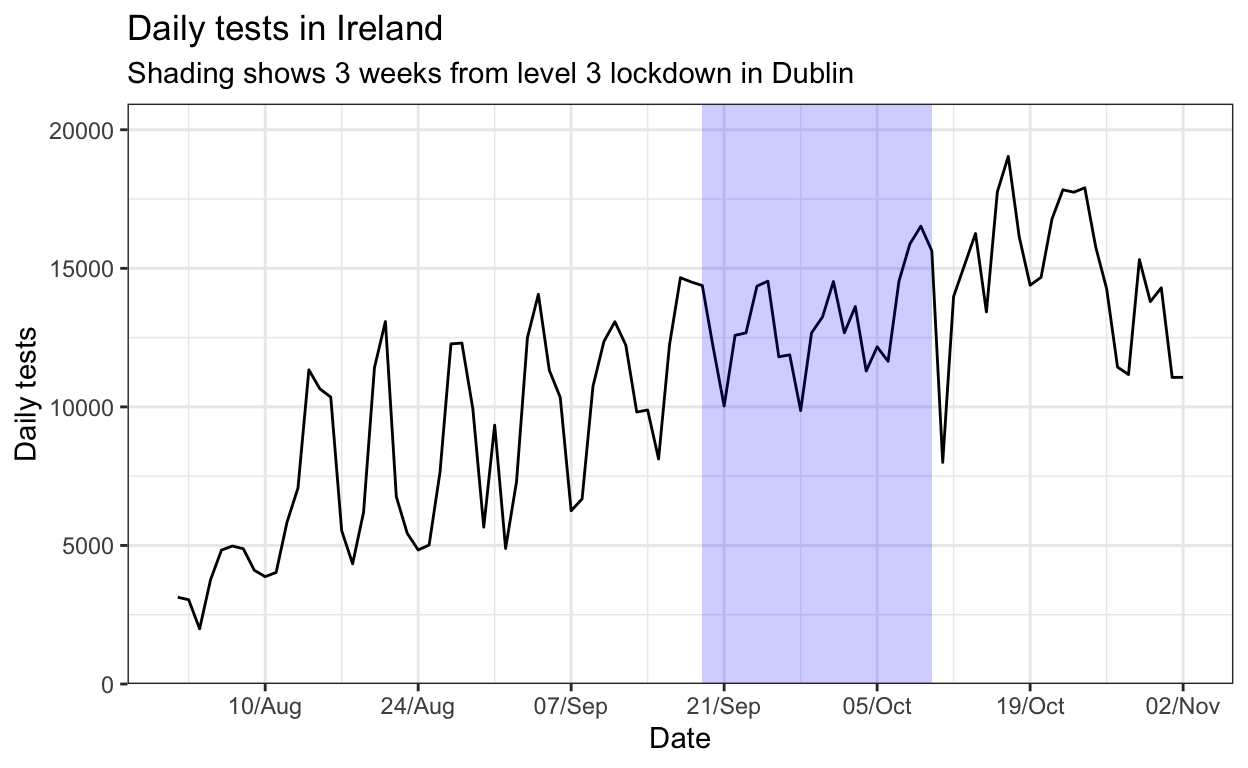
It seems that the trend for the number of tests across the country pretty much follows the trend of positive cases found in Dublin - constant over the level 3 period, but then rising a bit afterwards.
Unfortunately we can’t break it down to the numbers of tests per county. So we can’t tell or not if there was an increase in testing in Dublin four weeks after going into level 3.
But there is another metric we can look at for this period: changes in the estimate of the positivity rate (from tests across the last 7 days) for the whole country.
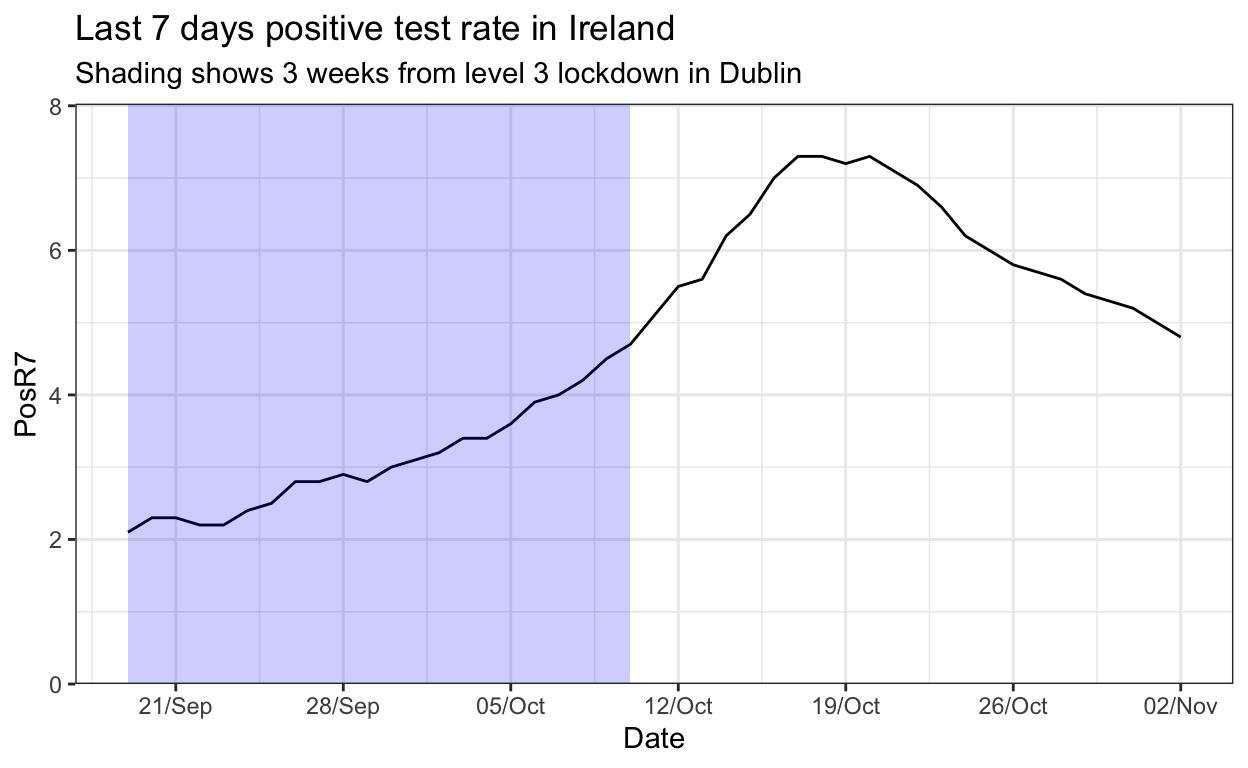
This seems to show that the positivity rate rose for the country, and was continuing to rise, for more than a month after the level 3 lockdown started in Dublin. This suggests that if level 3 worked, it took longer than 4 weeks, nearer to 5. It could also mean that the while the positivity rate nationally was falling, the number of cases in Dublin was still rising even weeks into level 3.
Finally let’s see if the same thing was happening in Cavan, Donegal, and Monaghan. Donegal entered level 3 on 25th September:
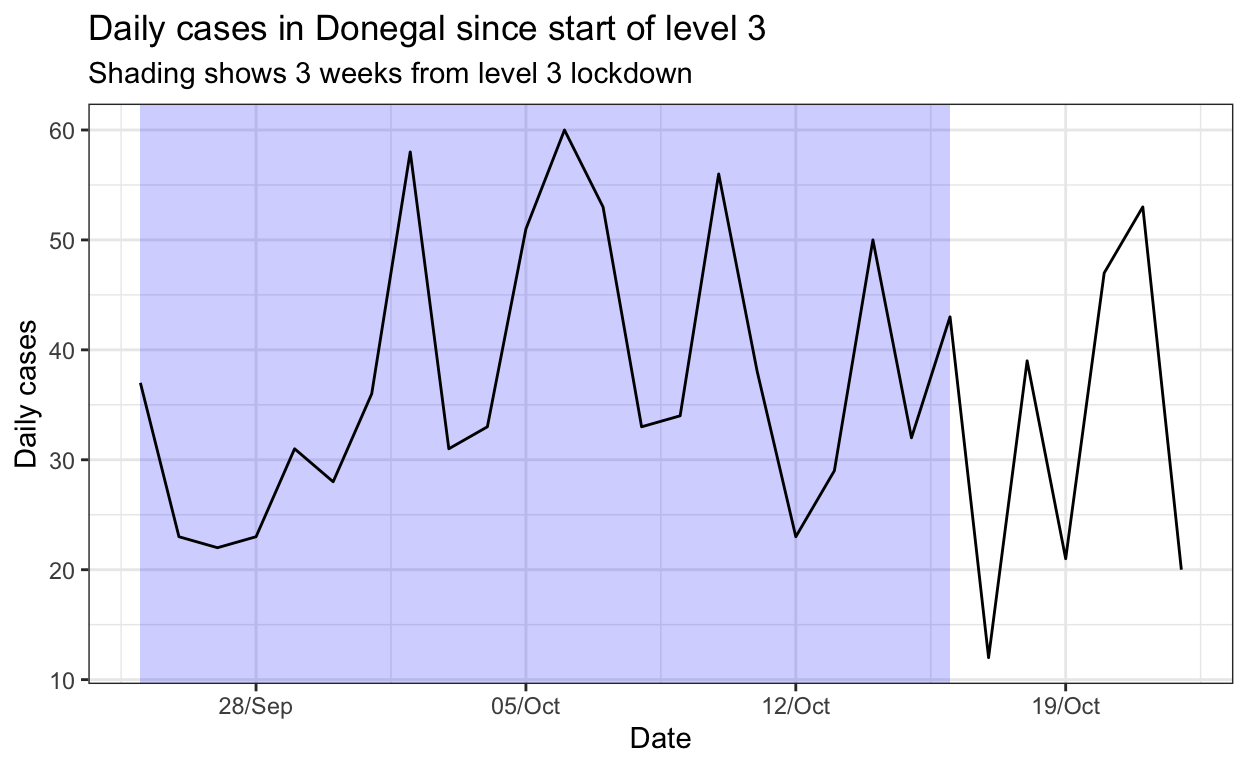
Cases in Donegal seem to have levelled off throughout the three-week period, even falling a little bit.
What about Cavan, Donegal and Monaghan who all entered level 4 on 15th October?
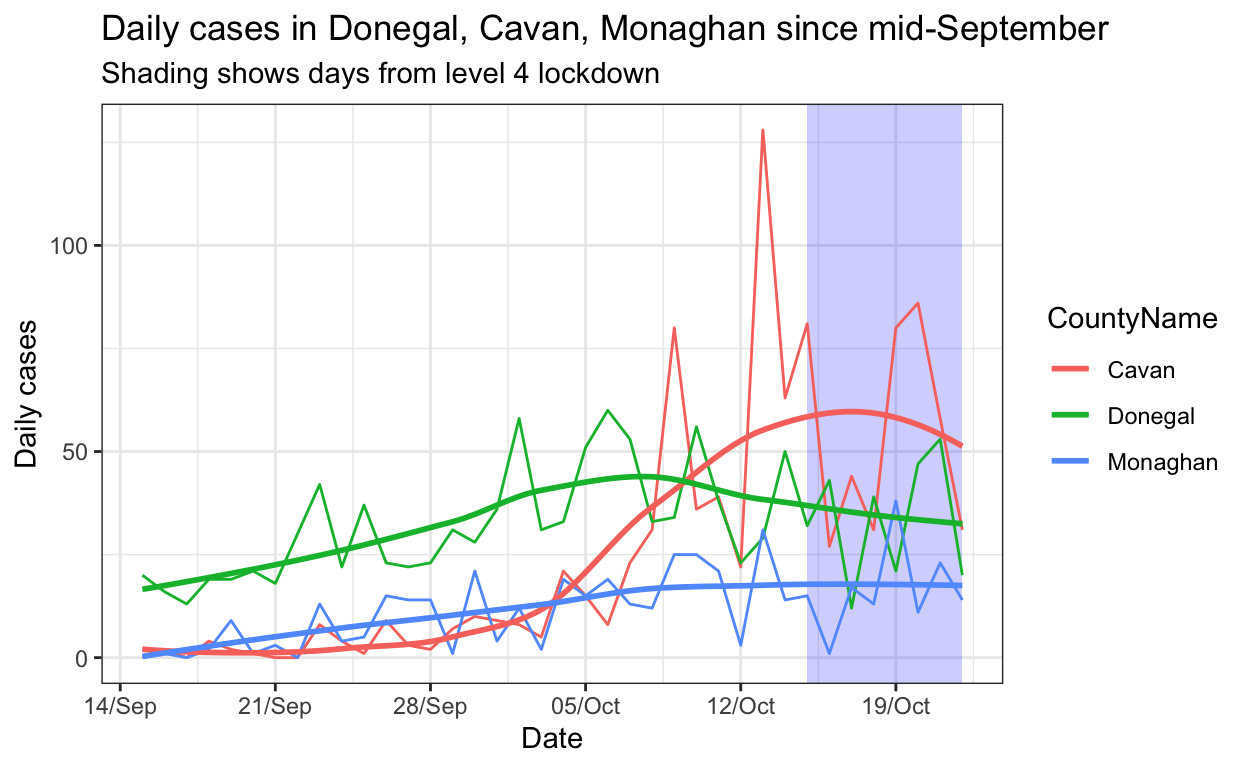
This seems to show that Cavan saw a big rise in COVID-19 cases at the start of October and was been levelling off, perhaps even before level 4 was introduced. We have included a smooth line here to make the longer-term changes clearer.
Conclusion
In short, we can’t tell yet from the data we have access to whether level 3 worked or not.
It seems like the border counties were starting to level off before the level 3 restrictions took place; but that Dublin was still rising after the level 3 lockdown.
The situation is complicated by the fact that we don’t have figures for the number of tests carried out in each county. If we did, we could break the positivity rate down by each county and see whether those counties with higher levels were starting to see falls in level 3 or 4, before the level 5 restrictions were introduced.
A final thing to be aware of is that, when the R number is around 1, the spread of the virus behaves like a random walk with cases shifting up and down without any clear expanding or contracting behaviour. We might be in that situation now, so it will be hard to estimate where the virus is going. Looking at the data again early next year, when we have the data and patterns for November, December and January, could give us more insights into how effective level 3 restrictions were in October.