tl;dr
- We downloaded the traffic data from Transport Infrastructure Ireland to look at traffic patterns along the border.
- There was a slightly higher spike in COVID-19 cases in border counties compared to other counties.
- There is no evidence that, during the period where the UK/Irish lockdown strategies diverged, or even beyond that period, there was differential travel between Northern Ireland and Ireland
Background
Back in April, there was a bit of a media storm over whether a spike in cases along Irish border (notably Cavan) was caused by the differential travel restrictions between Northern Ireland (NI) and Ireland This was most vocally stated by Dr Gabriel Scally, the President of the Epidemiology and Public Health section of the Royal Society of Medicine, in the Irish News, but was also picked up in the Irish Times, and the Guardian amongst many others.
The key point raised in the article was:
“Co. Cavan has the highest incidence rate of coronavirus in the south per 100,000 of the population, followed by Dublin and Monaghan.”
At this particular point in the pandemic, there were two slightly different lockdown strategies. Ireland had broadly a two-stage strategy, with schools, many workplaces, etc, closed on the 12th March, with everyone advised to stay at home from 27th March. Meanwhile the UK government closed bars on the 20th March, but didn’t enter into a ‘full’ lockdown until 28th March.
In theory, this means that those who travel to school or work in NI might have been doing so during those weeks between 12th March and 20th March, and so transferring the virus across the border.
The issue of the border county spike was downplayed by some of the senior NPHET members, most notably Tony Holohan said that it was ‘unlikely to be a spillover’:
“This is a disease and you get regional concentrations”
However, no-one seemed to really quote any evidence for or against these patterns. We thought we would have a look at traffic data to see if we could make a more informed opinion.
Was there a spike in cases by county?
If you download the county data for Ireland and plot the number of cases per 100k residents you will see the following:
Hover your mouse over the graph to identify individual counties. It’s not that clear to see the differences between the counties so let’s highlight the border counties of Cavan, Donegal, Leitrim, Monaghan and Sligo:
It certainly seems that Cavan and Monaghan are very high, with Cavan above even Dublin when corrected for population size. But perhaps some of the others (Leitrim, Sligo, etc) are pretty in line with the others. Was this due to the transport across the border? Or was it just regional variation in diseases due to something else, such as older populations, more care homes, etc?
Traffic data
Transport Infrastructure Ireland have a wonderful website where you can get hourly traffic counts for all of the stations in the country:
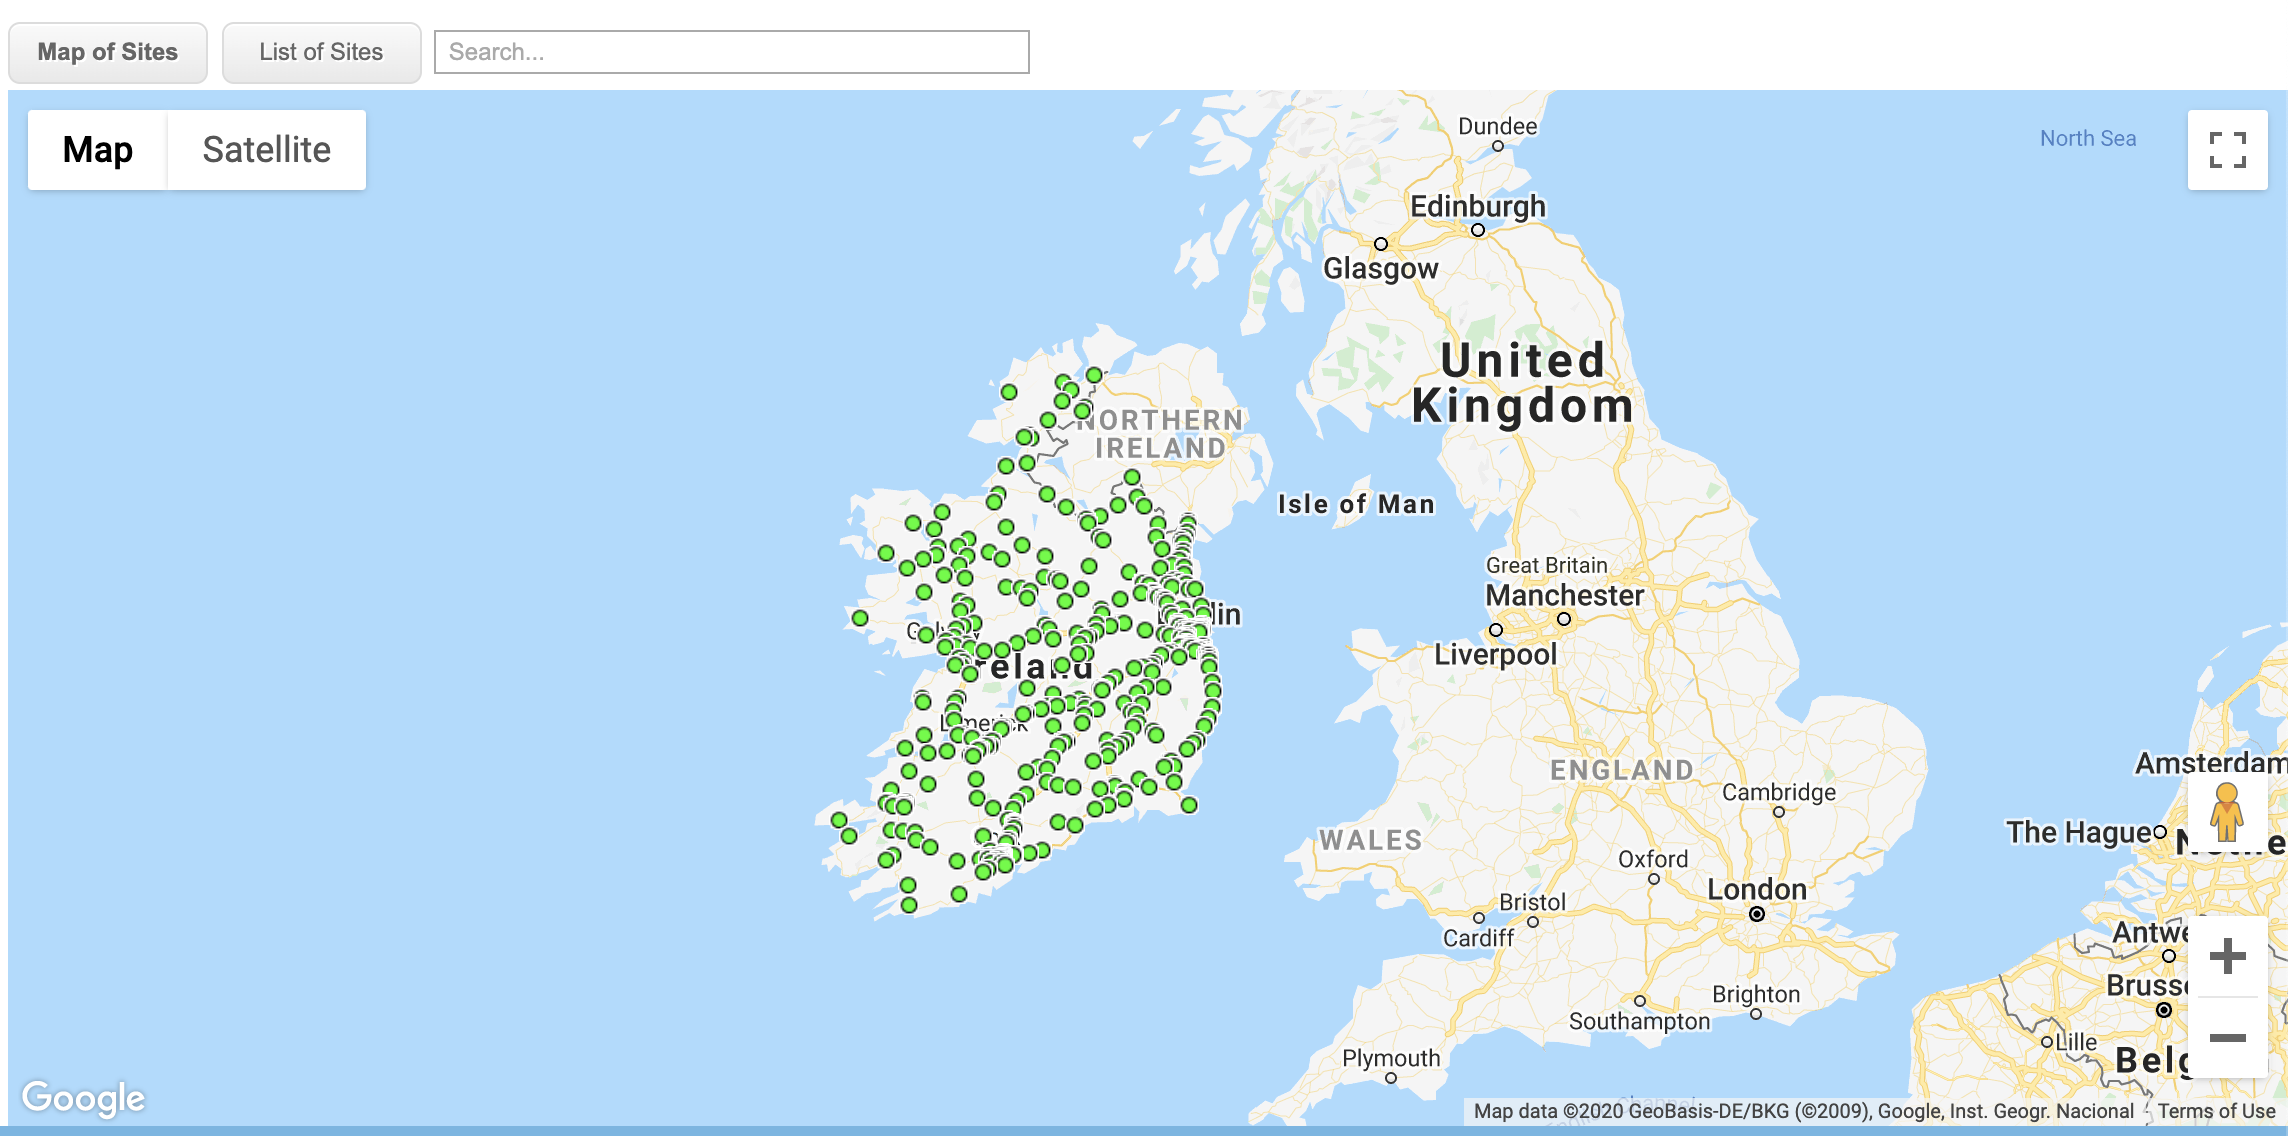
Each one of these green dots records the number of cars crossing that station in each direction every hour. We downloaded all the hourly traffic counts for all the stations to see when people were travelling and where they were doing.
To help with the understanding of this analysis, you can imagine a few different hypothetical scenarios:
- Aoife lives in Dundalk and is constantly out and about. After the lockdown started she can still see her friends in Northern Ireland carrying on as normal so she does pretty much the same. So we might expect the traffic stations around Dundalk (e.g. on the M1 or the N52) to record higher traffic activities than normal compared to non-border counties.
- Brendan lives in Letterkenny but likes to do his shopping in Strabane. After the lockdown started he carried on doing his shopping there because everything was still open, rather than shopping more locally. The station on the border on the N14 thus might still see a high count throughout the day as people travel back and forth to do their shopping compared to other stations in the same county.
- Caiomhe lives in Cavan and travels to work every day in Enniskillen. When the lockdown started on 12th March in Ireland she still had to go to work. The traffic station on the N3 at the border would still be recording a count of her car going to work in the morning and coming home in the evening, but the count of cars going south in the morning would be low, because people in the North are not travelling south to work.
Let’s see if we can check if whether Aoife, Brendan, or Caiomhe were guilty of that later spike in the border counties. Reminder: these are all hypothetical people! Other reminder: all the traffic station data we have (and all the cases by county) are from Ireland. Unfortunately, right now, we don’t have any comparable data from Northern Ireland.
Results
First up, here’s a plot of all the stations in the country by date. We’ve marked the two Irish lockdown dates of 12th and 27th March as black vertical lines. You can see that there is a big effect of the first lockdown and a levelling off after the 27th. Some of the stations have very high numbers of cars (over 150k per day); these are likely to be on the main motorways
Aoife
So were Aoife and people like her guilty of travelling in the border counties when everyone else was locked down? Let’s have a look at her local stations in Louth, compared to say stations in Meath:
Whilst there were more cars passing through Louth (likely because of the M1) actually it seems like she was pretty good and stayed home just like everyone else.
Verdict: Aoife is not guilty!
Brendan
Was Brendan crossing the border to do his shopping when he should have been staying closer to home? Let’s have a look at this station on the N14 compared to the other stations in county Donegal:
This station looks to have decreased just like the others.
Verdict: Brendan is not guilty!
Caiomhe
Was Caoimhe heading to work the cause of the later spike in the border counties? Here we need to be a bit more careful, as we need to separate out the stations into time windows. This is a plot of Caoimhe’s traffic station on the N3 between 7am and 10am in the morning, compared to all the other traffic stations along the border:
Well whilst Caoimhe crossed a pretty quiet station most morning, her morning commute was substantially less busy after the lockdown, just like all the other border stations.
Verdict: Caiomhe is not guilty!
Summary
In fact, no matter how you slice or dice the data, we could find no evidence that border counties, or traffic stations along the border, were any more active than other stations, or continued their activity after the lockdown started. Indeed during that gap of two weeks between the Irish lockdown and the NI lockdown, it looks as though people behaved pretty consistently across the country. So Dr. Scally, you can rest easy that there wasn’t a big effect of people travelling through the differential lockdown. We do need to do some more analysis though to work out what else might have caused it.
Final note
We’ve tried to make this article as friendly and open as possible, but we realise that some people reading this will have an interest in playing with the data themselves. Shortly, we’ll be making Apps available that allow people to explore the data in more detail, but in the meantime please contact us if you want to get access to the data we used to generate this post. The raw code for this post can be found on our GitHub page.