Studying The Navini Networks Diagnostic Utility(used in Irish Broadband Ripwave, Unwired Australia, nTelos Virginia)gmccullagh at gmail dot com.
Status:Due to reliability problems, my girlfriend recently moved to a cable modem service so I no longer have access to an Irish Broadband modem. As a result, I'm not really in a position to work on this project any more. If you are interested in working further on this, feel free to grab anything you need from this page and email me (see above) if you need help getting started. Quick Links
IntroWhen Irish Broadband ship their Ripwave modem, it comes with a proprietary diagnostic utility for Windows, Mac OS X and Linux (available for download on the Navini site).
The tool itself is handy to have providing various information about your modem and the connection. However, it being proprietary creates a couple of awkward problems on Linux.
With this in mind and out of pure curiosity, I decided to have a look at what the diagnostic utility actually does in order to see could we write a truly free one. I'm sticking my work up online in case anyone with better knowledge of these things happens to spot answers quicker than I do and can save me some time. If you see an answer, please feel free to email me at the address below. I've only been at this for a few hours really, so this is very early stages. Other interesting sources of information around include:
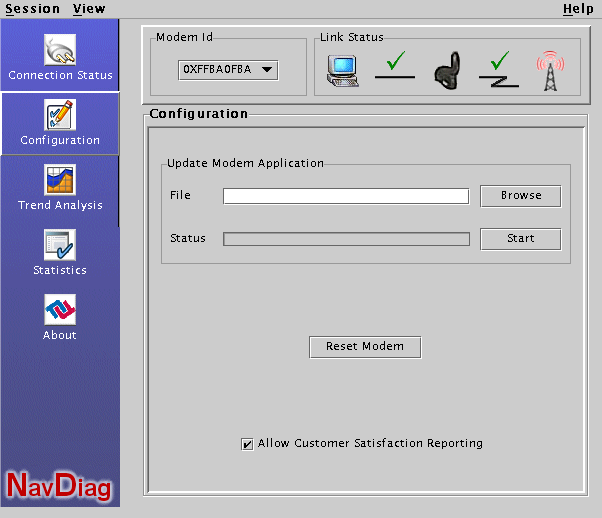
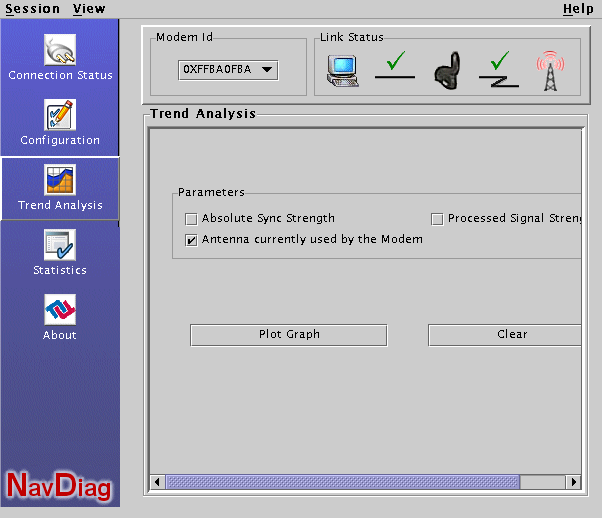
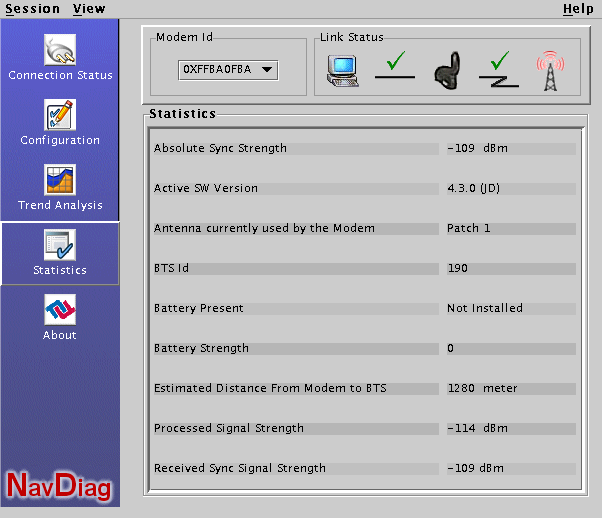
ScreenshotsSome screenshots of the application:Extra InformationTo get a tonne of extra, more detailed information from the navini application, you need to hit <shift><ctrl><F10>. Not knowing this is very bad :-) Network TrafficRegardless of whether or not the monitoring utility is running, the modem broadcasts a UDP datagram (from 169.254.254.1 port 3859 to 255.255.255.255) every second. The diagnostic utility presumably reads this as it updates most of its displayed information every second, apparently in response to this packet. Using tcpdump these packets of length 336 can be seen arriving each second. Below is a sample packet. The bits marked green are identified and are hyperlinked to their descripton on this page. sudo tcpdump -c 300 -i eth0 -s 0 -X udp port 3859 and less 400 and greater 300 22:30:33.593814 169.254.254.1.3859 > 255.255.255.255.3859: udp 336 0x0000 4500 016c 0000 0000 ff11 1281 a9fe fe01 E..l............ 0x0010 ffff ffff 0f13 0f13 0158 8a49 0203 0001 .........X.I.... 0x0020 0001 0000 0001 0000 0000 0000 0000 ffba ................ 0x0030 0fba 0214 0616 1d09 0b29 0401 07d5 0b29 .........).....) 0x0040 0401 07d5 0000 0000 006c 0403 0403 0300 .........l...... 0x0050 0000 0030 0001 0000 00be ffff 7bff 0127 ...0........{..' 0x0060 0003 0640 0001 0007 0001 0000 0000 0004 ...@............ 0x0070 0000 0000 0000 ffff 0019 409f 0019 0076 ..........@....v 0x0080 006c ffe6 ff18 0004 fb00 0004 0002 100a .l.............. 0x0090 0a0a 0000 0000 ffff ffff 0000 0000 ffff ................ 0x00a0 ffff 7598 9898 ff91 0031 0001 0000 0000 ..u......1...... 0x00b0 0000 0000 af38 0053 010e 0000 0000 a9fe .....8.S........ 0x00c0 fe01 0000 1093 0000 03f8 0000 1078 0000 .............x.. 0x00d0 0d04 0000 0000 0000 02de 0000 0029 0000 .............).. 0x00e0 0098 0000 0025 0000 001d 0000 0001 0000 .....%.......... 0x00f0 0062 0000 11b9 0000 29b3 0000 2774 0000 .b......)...'t.. 0x0100 2918 0000 2808 0000 0661 0000 03b0 0000 )...(....a...... 0x0110 2722 0000 09ff 0000 0025 0000 18dc 0000 '".......%...... 0x0120 09dc 0000 02b0 0000 0000 0000 00d1 0000 ................ 0x0130 088d 0000 09c3 0000 1912 0000 1d85 0000 ................ 0x0140 101e 0000 0211 0000 0186 0000 0033 0000 .............3.. 0x0150 0000 0000 0024 0000 0090 0000 012c 0000 .....$.......,.. 0x0160 01b2 0000 0183 0000 00db 4d4d ..........MM While monitoring, every few minutes (or thereabouts), a request(?) packet of length 22 goes out seemingly from the diagnostic utility (this only happens with the tool running), which is always followed by a response(?) datagram from the modem of length 400. I haven't as yet noted a visible reaction to this in the GUI -- although I haven't been looking. The packet of length 400 sometimes disappears if you turn off "Allow Customer Satisfaction Reporting" in the application. The most thorough analysis of these packets has been done by Matthew Hilder and is here. 14:21:36.424694 sn127806940122.dhcp-ripwave.irishbroadband.ie.3859 > 255.255.255.255.3859: udp 22 (DF) 0x0000 4500 0032 0000 4000 4011 87c4 57c0 5b37 E..2..@.@...W.[7 0x0010 ffff ffff 0f13 0f13 001e 1dd4 0101 0001 ................ 0x0020 0004 0045 0001 0000 0000 0000 0000 ffba ...E............ 0x0030 0fba .. 14:21:36.496982 169.254.254.1.3859 > sn127806940122.dhcp-ripwave.irishbroadband.ie.3859: udp 400 0x0000 4500 01ac 0000 0000 ff11 5f49 a9fe fe01 E........._I.... 0x0010 57c0 5b37 0f13 0f13 0198 8252 0102 0001 W.[7.......R.... 0x0020 0005 0045 0001 0000 0000 0000 0000 0000 ...E............ 0x0030 0000 0000 0000 0000 0000 0000 0000 0000 ................ 0x0040 0000 0000 0000 0000 0000 0000 0000 0000 ................ 0x0050 0000 0000 0000 0000 0000 0000 0000 0000 ................ 0x0060 0000 0000 0000 0000 0000 0000 0000 0000 ................ 0x0070 0000 0000 0000 0000 0000 0000 0000 0000 ................ 0x0080 0000 0000 0000 0000 0000 0000 0000 0000 ................ 0x0090 0000 0000 0000 0000 0000 0000 0000 0000 ................ 0x00a0 0000 0000 0000 0000 0000 0000 0000 0000 ................ 0x00b0 0000 0000 0000 0000 0000 0000 0000 0000 ................ 0x00c0 0000 0000 0000 0000 0000 0000 0000 0000 ................ 0x00d0 0000 0000 0000 0000 0000 0000 0000 0000 ................ 0x00e0 0000 0000 0000 0000 0000 0000 0000 0000 ................ 0x00f0 0000 0000 0000 0000 0000 0000 0000 0000 ................ 0x0100 0000 0000 0000 0000 0000 0000 0000 0000 ................ 0x0110 0000 0000 0000 0000 0000 0000 0000 0000 ................ 0x0120 0000 0000 0000 0000 0000 0000 0000 0000 ................ 0x0130 0000 0000 0000 0000 0000 0000 0000 0000 ................ 0x0140 0000 0000 0000 0000 0000 0000 0000 0000 ................ 0x0150 0000 0000 0000 0000 0000 0000 0000 0000 ................ 0x0160 0000 0000 0000 0000 0000 0000 0000 0000 ................ 0x0170 0000 0000 0000 0000 0000 0000 0000 0000 ................ 0x0180 0000 0000 0000 0000 0000 0000 0000 0000 ................ 0x0190 0000 0000 0000 0000 0000 0000 0000 0000 ................ 0x01a0 0000 0000 0000 0000 0000 0000 Antenna in UseThe antenna in use seems to be contained in position 007a. This has three values:
The output below is just line 0x0070 in a period where I started on Patch 1, then turned the modem to swap it to Patch 2, then hung Al foil on the body (to force use of the upright), then removed the foil and turned the body back around to Patch 1. gavin@debian:~$ sudo tcpdump -s 0 -X -i eth0 udp port 3859 and less 380 and greater 300 |grep 0x0070 tcpdump: listening on eth0 0x0070 0000 0000 0000 ffff 0019 20bc 0018 0064 ...............d 0x0070 0000 0000 0000 ffff 0019 20ba 0015 0063 ...............c 0x0070 0000 0000 0000 ffff 0019 40be 000f 0066 ..........@....f 0x0070 0000 0000 0000 ffff 0019 20be 0019 0063 ...............c 0x0070 0000 0000 0000 ffff 0019 20be 0019 005f ..............._ 0x0070 0000 0000 0000 ffff 0019 20be 0019 0075 ...............u 0x0070 0000 0000 0000 ffff 0019 00c0 0016 0065 ...............e 0x0070 0000 0000 0000 ffff 0019 40bc 0018 0067 ..........@....g 0x0070 0000 0000 0000 ffff 0019 40bc 0018 0067 ..........@....g 0x0070 0000 0000 0000 ffff 0019 40bc 0018 0068 ..........@....h 0x0070 0000 0000 0000 ffff 0019 40bc 0018 0066 ..........@....f 0x0070 0000 0000 0000 ffff 0019 40bc 0018 0066 ..........@....f 0x0070 0000 0000 0000 ffff 0019 40bc 0018 0066 ..........@....f 0x0070 0000 0000 0000 ffff 0019 40bc 0018 0068 ..........@....h 0x0070 0000 0000 0000 ffff 0019 40bc 0018 0066 ..........@....f 0x0070 0000 0000 0000 ffff 0019 00bc 0018 0067 ...............g 0x0070 0000 0000 0000 ffff 0019 00bc 0018 006d ...............m 0x0070 0000 0000 0000 ffff 0019 00bc 0018 006b ...............k 0x0070 0000 0000 0000 ffff 0019 00bc 0018 006a ...............j 0x0070 0000 0000 0000 ffff 0019 00bc 0018 006a ...............j 0x0070 0000 0000 0000 ffff 0019 40bc 0018 0067 ..........@....g 0x0070 0000 0000 0000 ffff 0016 20bc 0014 0064 ...............d 0x0070 0000 0000 0000 ffff 0018 20bc 0017 0064 ...............d 0x0070 0000 0000 0000 ffff 0019 20bc 0018 0065 ...............e strace ./Navini_Diagnostics &> strace.outAt Colm MacCarthaigh's request, the bzipped output of an strace is of the diagnostic tool is here. Of course as Paul pointed out, that was shag all use. The output of strace with the -f option is here.
Colm also suggested raw pcap info was the only useful data. The scan above is from a more recent run. The bzipped raw pcap info is here (actually it's not properly filtered, I'll replace it soon). Config filesPaul Jakma pointed toward the file EPEventDef.txt, which looks useful. It seems to be a translation table for converting a number of numeric signals from the modem into more useful text. Modem IDMatthew Hilder sent this email to point out that the hardware address of the modem (in this case FFBA0FBA) is visible at position 2E.
14:21:51.080310 IP 169.254.254.1.3859 > 255.255.255.255.3859: UDP, length 336
        0x0000:  4500 016c 0000 0000 ff11 1281 a9fe fe01  E..l............
        0x0010:  ffff ffff 0f13 0f13 0158 3e12 0203 0001  .........X>.....
        0x0020:  0001 0000 0001 0000 0000 0000 0000 ffba  ................
        0x0030:  0fba 020b 060e 1506 0b29 0401 07d5 0b29  .........).....)
        0x0040:  0401 07d5 0000 0000 0058 0403 0403 0300  .........X......
        0x0050:  0000
Modem TimeThe modem seems to have an internal date and time, presumably set from a network server. This is apparently used by the navini application to plot statistical parameters against time. It turns out that this time is contained in the 6 bytes at 0x0032, one each for month, day, year, hour, minute, second. For example (around 19/02/2006 21:46): tcpdump -s0 -X -i eth0 udp port 3859 and less 400 and greater 300 |grep 0x0030 0x0030 0fba 0213 0615 2e39 0b29 0401 07d5 0b29 .......9.).....) 0x0030 0fba 0213 0615 2e3a 0b29 0401 07d5 0b29 .......:.).....) 0x0030 0fba 0213 0615 2e3b 0b29 0401 07d5 0b29 .......;.).....) 0x0030 0fba 0213 0615 2f00 0b29 0401 07d5 0b29 ....../..).....) 0x0030 0fba 0213 0615 2f01 0b29 0401 07d5 0b29 ....../..).....) 0x0030 0fba 0213 0615 2f02 0b29 0401 07d5 0b29 ....../..).....) Network IDThe Network ID seems to be the unique id of the network you are connected to (eg Irish Broadband Dublin?). Matthew Hilder points out that this is visible in position 5E of the regular udp packets. In this example, I'm using Network ID 295 (hex 127).
13:14:40.613036 169.254.254.1.3859 > 255.255.255.255.3859:  udp 336
	0x0000   4500 016c 0000 0000 ff11 1281 a9fe fe01        E..l............
	0x0010   ffff ffff 0f13 0f13 0158 6a30 0203 0001        .........Xj0....
	0x0020   0001 0000 0001 0000 0000 0000 0000 ffba        ................
	0x0030   0fba 020c 060d 0d37 0b29 0401 07d5 0b29        .......7.).....)
	0x0040   0401 07d5 0000 0000 005c 0403 0403 0300        .........\......
	0x0050   0000 0030 0001 0000 001e ffff 7bff 0127        ...0........{..'
	0x0060   0003 06a4 0001 0007 0001 0000 0000 0001        ................
	0x0070   0000 0000 0000 ffff 0018 20bc 0018 0065        ...............e
	0x0080   005c ff9b ff18 0000 ff00 0004 0000 130a        .\..............
	0x0090   0a0a 0000 0000 ffff ffff 0000 0000 ffff        ................
	0x00a0   ffff 6790 9090 ffa2 0034 0001 0000 0000        ..g......4......
	0x00b0   0000 0000 4e15 0008 010e 0000 0000 a9fe        ....N...........
	0x00c0   fe01 0000 3de6 0000 1668 0000 3dd9 0000        ....=....h..=...
	0x00d0   340d 0000 0000 0000 0a95 0000 002b 0000        4............+..
	0x00e0   0055 0000 0032 0000 000a 0000 0008 0000        .U...2..........
	0x00f0   0004 0000 4ff8 0000 89ef 0000 85c8 0000        ....O...........
	0x0100   8de6 0000 87b0 0000 01a9 0000 0129 0000        .............)..
	0x0110   8653 0000 216d 0000 0032 0000 4469 0000        .S..!m...2..Di..
	0x0120   9c17 0000 5a89 0000 2619 0000 67c2 0000        ....Z...&...g...
	0x0130   334f 0000 236f 0000 03cf 0000 2e33 0000        3O..#o.......3..
	0x0140   0b2d 0000 0384 0000 081d 0000 04d0 0000        .-..............
	0x0150   01f2 0000 0595 0000 02e7 0000 0220 0000        ................
	0x0160   0046 0000 0358 0000 009a 4d4d                  .F...X....MM
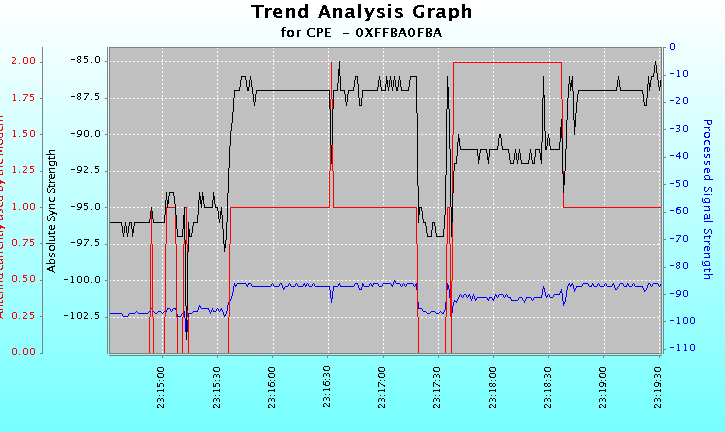
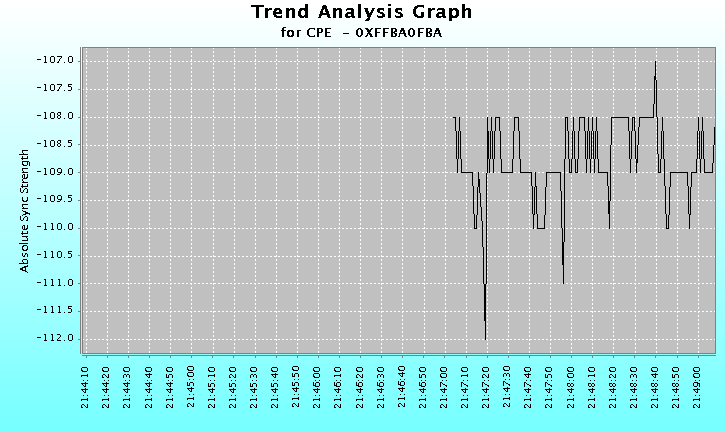
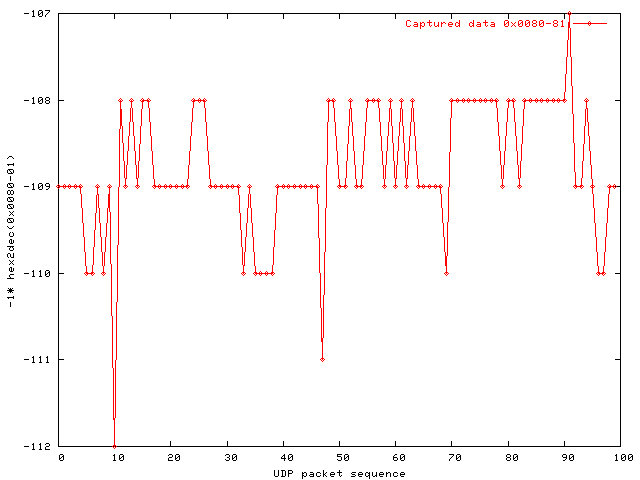
Interestingly, Irish Broadband's dhcp addresses seem to resolve with reverse DNS lookups, eg sn127806940122.dhcp-ripwave.irishbroadband.ie. It may or may not be coincidence that the first 3 digits are 127. BTS IDThe BTS ID is (as I understand it) a unique identifier within a given network to indicate the BTS (or access point/mast) which you're modem is connected to. This is contained in position 59 of the UDP packet. On Mountjoy Square, the BTS the application reports is 30 (Hex 1E). In Clontarf, the BTS is 190 (Hex BE). Below are snippets from UDP packets in the two locations: tcpdump -c 100 -s0 -X -i eth0 udp port 3859 and less 400 and greater 300 |grep 0x0050 0x0050 0000 0030 0001 0000 001e ffff 7bff 0127 0x0050 0000 0031 0001 0000 001e ffff 7bff 0127 0x0050 0000 0031 0001 0000 001e ffff 7bff 0127 0x0050 0000 0031 0001 0000 001e ffff 7bff 0127 tcpdump -c 100 -s0 -X -i eth0 udp port 3859 and less 400 and greater 300 |grep 0x0050 0x0050 0000 0030 0001 0000 00be ffff 7fff 0127 ...0...........' 0x0050 0000 0031 0001 0000 00be ffff 7fff 0127 ...1...........' 0x0050 0000 0031 0001 0000 00be ffff 7fff 0127 ...1...........' 0x0050 0000 0031 0001 0000 00be ffff 7fff 0127 ...1...........' Absolute Sync StrengthAs far as I can tell, the Absolute Sync Strength is contained in the 2 bytes at either 0x0080 0x0049. These positions invariably have the same value but so do Absolute Sync Strength and Received Sync Signal Strength. Below are two plots, the first comes from the Navini Diagnostic Utility, the second is from plotting the bytes at 0x0080-81 converted to decimal and negated. I will try and get a better scaled graph soon but this illustrates the point reasonably well.
It would appear that this is the signal which is plotted as signal strength on the Connection Status screen. TemperatureIt seems the temperature is 1 byte at position 0x00a9. tcpdump -c 100 -s0 -X -i eth0 udp port 3859 and less 400 and greater 300 |grep 0x00d0 0x00a0 ffff 7198 9898 ff8d 002f 0001 0000 0000 ..q....../...... 0x00a0 ffff 7098 9898 ff8d 002f 0001 0000 0000 ..p....../...... 0x00a0 ffff 7098 9898 ff8c 0030 0001 0000 0000 ..p......0...... 0x00a0 ffff 7298 9898 ff8b 0030 0001 0000 0000 ..r......0...... Active/Standby Software TimestampsThe Active and Standby Software Timestamps are contained in 2 sequential sets of 6 bytes at position 0x0038 and 0x003e. Not certain which is which, but I know which way round I'd guess. Active/Standby Software VersionsI suspect the active and standby software versions are stored at two sequential 2-byte positions 0x004A and 0x004C. In my case both versions are 4.3.0 ad the values are 0403 0403. Signal To Noise RatioThe carrier specific signal-to-noise ratio is contained in the byte at position 0x008e. 0x0080 0070 ffe3 ff08 0004 0000 0004 0002 0d0a .p.............. 0x0080 006f ffe3 ff08 0004 0000 0004 0002 0f0a .o.............. 0x0080 006e ffe3 ff08 0008 00f0 0008 0003 080a .n.............. 0x0080 006e ffe2 ff08 0004 ff00 0004 0002 0f0a .n.............. 0x0080 006e ffe1 ff08 0004 ff00 0004 0002 0f0a .n.............. 0x0080 006e ffe2 ff08 0004 ff00 0004 0002 0f0a .n.............. 0x0080 006e ffe2 ff08 0004 ff00 0004 0002 100a .n.............. There is also a second more general(?) signal to noise ratio which can be seen on the Statistics screen and on the connection status graphs. It generally has a lower value. This is the parameter (aka signal quality) which seems to determines whether you get an orange, red or green light on your modem. It seems (in my experience) to be the most important parameter in deciding how good your connection is. It is plotted on the Connection Status screen along with a bar. Despite having an apparently strong signal, I very often find that I have a very poor quality and (as an apparent result) a poor connection. Packet HeadersThe common (len 336) Packet UDP/IP headers have been analysed by Matthew Hilder. The full text is here The irregular 22/400 length packet UDP/IP headers have also been analysed by Matthew. The full text is here Replacement Application?It's getting to the stage where a replacement application could be feasible. I've made a quick start at a simple perl command line tool to display the values which we can currently read. It works and reads information from the packets but there's still work to do to get the full information provided by the original application. Any suggestions? gmccullagh at gmail dot com. |
